The market of cryptocurrency remains volatile. Solana (SOL) is notable as a currency of primary importance, and is preparing to face the possibility of a major change in sentiment towards bulls. The basis for this is harmonic patterns, RSI divergence, and breakout retests SOL may be an indication of a chance to invest with great value.
This blog will look at the most important harmonic goals, market structure as well as Solana’s potential for the long term for traders and investors to make their positions more strategic.
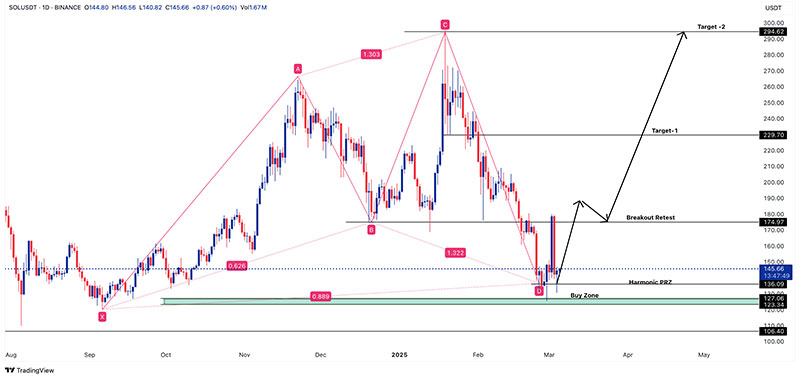
A harmonic trading pattern appears on Solana’s chart which suggests a possible price reversal arising from a crucial Harmonic PRZ (Potential Reversal Zone).
Table of Contents
- 1 Harmonic Setup Breakdown
- 2 Fibonacci & Harmonic Levels at Play
- 3 The Price Action Targets Harmonic vs. Structural Levels
- 4 RSI Divergence: The Hidden Catalyst for the Breakout
- 5 Market Dynamics: Solana’s Strength in Numbers
- 6 The Road Ahead: Can SOL Hit $294?
- 7 Final Thoughts: The Perfect Investment Opportunity?
Harmonic Setup Breakdown
- The pattern is aligned with a Bullish Bat or Gartley formation as well as key Fibonacci Retracement levels serving as pivot areas.
- The “D” part of the harmonic setup is aligned with the 127-136 USDT buy zone. This is a traditionally significant region of demand.
- Retracement ratios (0.618, 0.886, 1.272) indicate this is the most likely trading set-up.
Fibonacci & Harmonic Levels at Play
- 0.618 Fib Retracement: Strong support around $136
- 0.886 Fib Extension: Local bottom confirmation for $127
- 1.272 Fib Projection: A crucial breakthrough threshold for $174.
The Harmonic pattern of the PRZ (Potential Reversal Zone) in the range of $127 to $136 implies that Solana is already at an upper bottom, and is now well-positioned to begin an upward trend.
The Price Action Targets Harmonic vs. Structural Levels
Immediate Levels to Watch
- Buy Zone: $127 – $136 (Harmonic Reversal Zone)
- Breakout Retest: 174$ (Key resistance to continued bullishness)
- Target 1: $229 (Major Fibonacci resistance & prior supply zone)
- Target 2: $294 (Full harmonic extension goal)
This configuration indicates an intense confluence between harmonic patterns as well as structural price movements, which reinforces the bullish outlook.
RSI Divergence: The Hidden Catalyst for the Breakout
Alongside the optimistic attitude, RSI divergence paints a impressive picture of an acceleration recovery.
- Price had lower lows, but, RSI created higher lows which is a common bearish divergence, which suggests an increase in the selling pressure.
- If RSI exceeds 50, anticipate a strong trend towards a breakout retest of $174.
- Any move that is higher than RSI 60-70 may result in a parabolic rise from $229 to $294.
Conclusion The harmonic PRZ together to RSI divergence, has a positive effect on the arguments for a sustainable bullish trend.
Market Dynamics: Solana’s Strength in Numbers
Market Dynamics: Strength in Solana is in the Figures in March 2025 Solana holds the top spot in the crypto market, which is supported by solid foundations as well as the trust of banks.
- Market Cap $74.23 billion (One of the most popular cryptocurrency)
- 24-Hour Trading Volume: $6.66 billion (Strong liquidity, increasing demand)
The large trading volume and its high market cap show an ongoing interest from investors and the stability of markets, which makes Solana an excellent investment for accumulation over the long term.
The Road Ahead: Can SOL Hit $294?
With its harmonic targets, RSI confirmation and an underlying price structure that is strategic, Solana is getting ready for an eventual rally of a magnitude.
Key Milestones:
- If you break above $174, it can start a trend towards $229.
- A sustained buying pressure may push SOL towards the harmonic goal of $294.
- Should Bitcoin (BTC) remains in an upward trend, look for SOL to rise along with it.
Thanks to its technology strength as well as its institutional acceptance and harmonic convergence, Solana remains one of the best blockchain investment options to come in the near future.
Final Thoughts: The Perfect Investment Opportunity?
The harmony of Solana and its solid market positioning, and the other indicators point towards an eventual rise in the market.
- For investors, the accumulation of between $127-$136 can provide a good return-to-risk ratio.
- For traders, a break above $174 could signal a major expansion of the bull market.
Could Solana get $294 and perhaps even more? All done. Next step is to go for the market to come to a the final decision!
We would love to hear your feedback by leaving a comment below. Do you have a positive or negative opinion regarding SOL?